
Figure 3. Total daily energy expenditure and energy expenditure associated with habitual wake and sleep episodes.
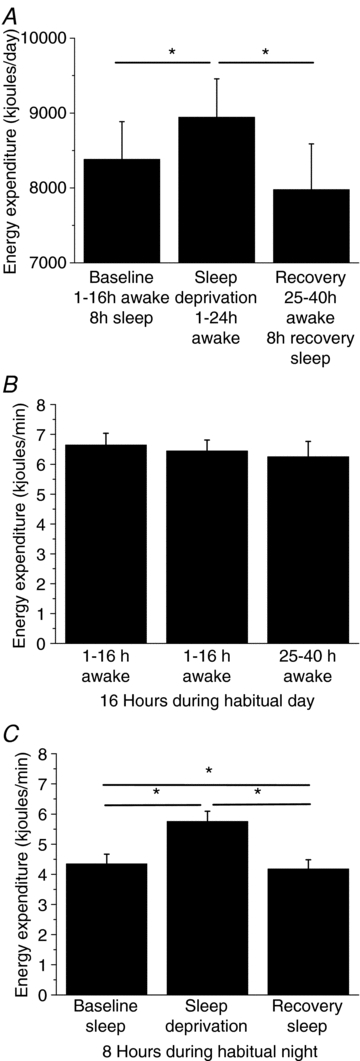
A, total daily EE in kJ day−1 for each day of the study. Energy expenditure in kJ min−1 during the 16 h habitual wake episode (B) and the 8 h habitual sleep episode (C). Lines represent significant differences between data at endpoints of the line. *P < 0.05. Error bars represent s.e.m.