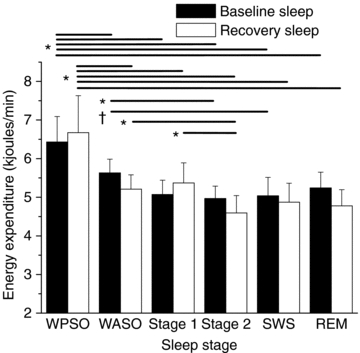
Figure 4. Energy expenditure during wakefulness and sleep stages.

The EE associated with WPSO was significantly greater (P < 0.05) than any stage of sleep and WASO during the baseline (black) and recovery (white) nights. The EE associated with WASO was significantly different to stage 2 during the baseline and recovery nights. The EE associated with stage 1 was significantly different to stage 2 during the recovery night. The EE associated WASO had a non-significant trend for being different to SWS during the baseline night. Lines represent significant differences between stages at endpoints of the line. N = 6. Error bars represent s.e.m. *P < 0.05 between sleep stages within nights. †P = 0.053
