
Fig 1.
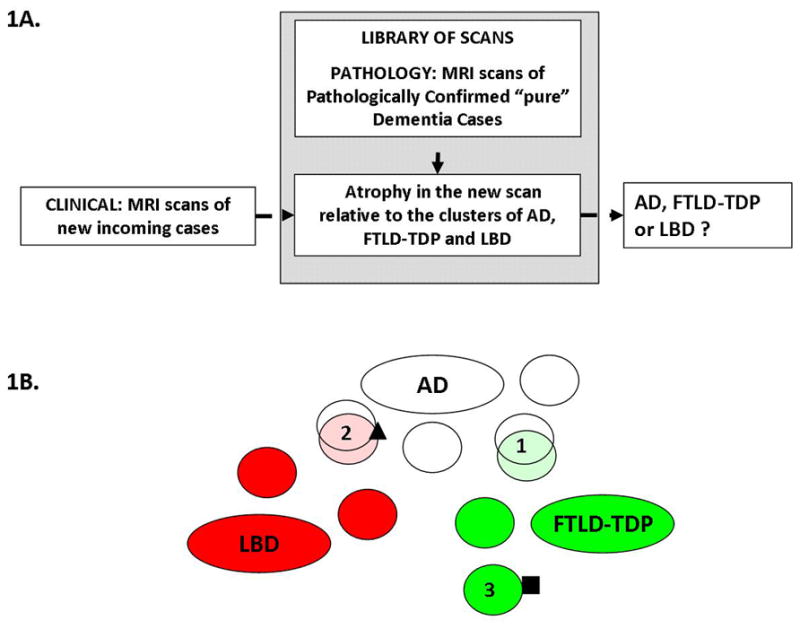
A) Schematic of the Differential-STAND system: atrophy in the new incoming scan is compared to the library of scans of pathologically confirmed cases and classified as AD, LBD or FTLD-TDP. B) Illustration of the clustering and classification approach. The dementia subtypes (or equivalently, patient clusters) are represented by ovals: white for AD, red for LBD and green for FTLD-TDP. An incoming patient, depicted as the square is diagnosed unambiguously as suffering from FTLD-TDP because he falls into the patient cluster #3 which is a subtype of FTLD-TDP. However an incoming patient depicted as a triangle will be diagnosed as belonging to cluster #2 which is a mixture of AD and LBD cases with similar atrophy patterns. Some inevitable overlap remains, mostly due to similarities in atrophy patterns between the dementia subtypes such as clusters 1 and 2.