
Fig. 3.
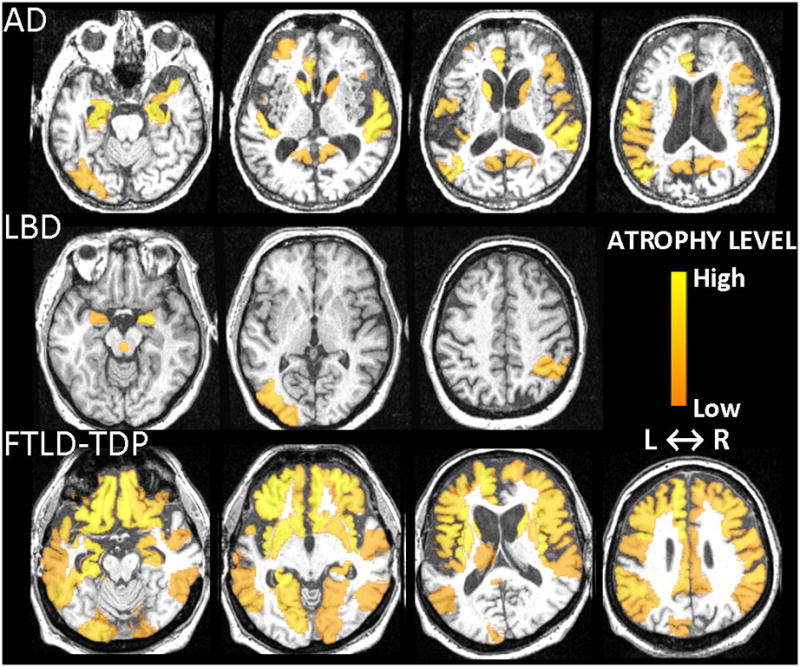
Typical Differential-STAND Maps of three different patients: AD, LBD and FTLD-TDP (Z-scores<−1). Colorbar represents the atrophy level relative to the CN reference image database and absolute value of the Z-score is shown.
Official websites use .gov
A
.gov website belongs to an official
government organization in the United States.
Secure .gov websites use HTTPS
A lock (
) or https:// means you've safely
connected to the .gov website. Share sensitive
information only on official, secure websites.
Typical Differential-STAND Maps of three different patients: AD, LBD and FTLD-TDP (Z-scores<−1). Colorbar represents the atrophy level relative to the CN reference image database and absolute value of the Z-score is shown.