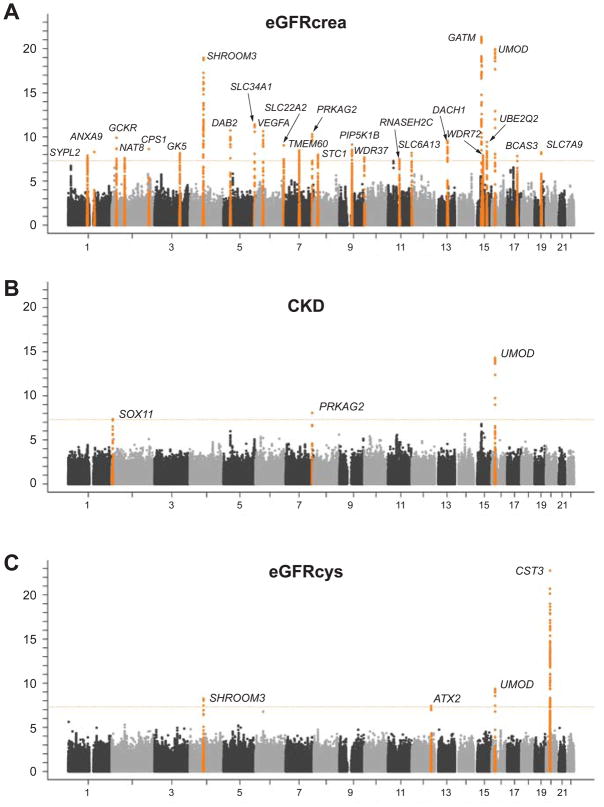
Figure 1. Meta-analysis -log10(P-value) vs. genomic position plots for CKD (A), eGFRcrea (B), and eGFRcys (C) in the discovery samples.
Genomic loci with evidence of suggestive association (p<4*10−7) are plotted in orange and with significant association (p<5*10−8) in red, with the exception of the SNP at the JAG1 locus on chromosome 20 (panel B, grey) which did not replicate.

