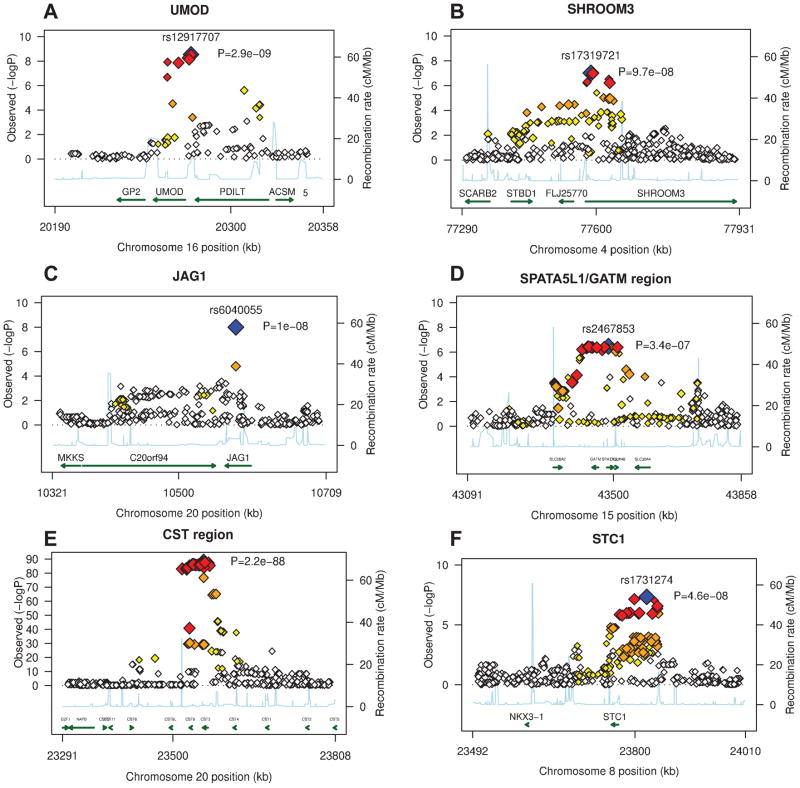
Figure 2. Genetic architecture of the genome-wide significant susceptibility loci for renal disease in the discovery samples: (A): UMOD gene region, (B): SHROOM3 gene region, (C): GATM/SPATA5L1 gene region, (D) CST genes region, (E) STC1 gene region.
−log10 P-values are plotted versus genomic position (Build 36). The most significant SNP in each region is plotted in blue. LD based on the HapMap CEU sample is color-coded: red (r2 to top SNP 0.8–.0), orange (0.5–.8), yellow (0.2–.5), and white (<0.2). Gene annotations are based on Build 36 and arrows present direction of transcription. P-values are obtained from the discovery traits: CKD (UMOD), eGFRcrea (SHROOM3, GATM), eGFRcys (CST, STC1).

