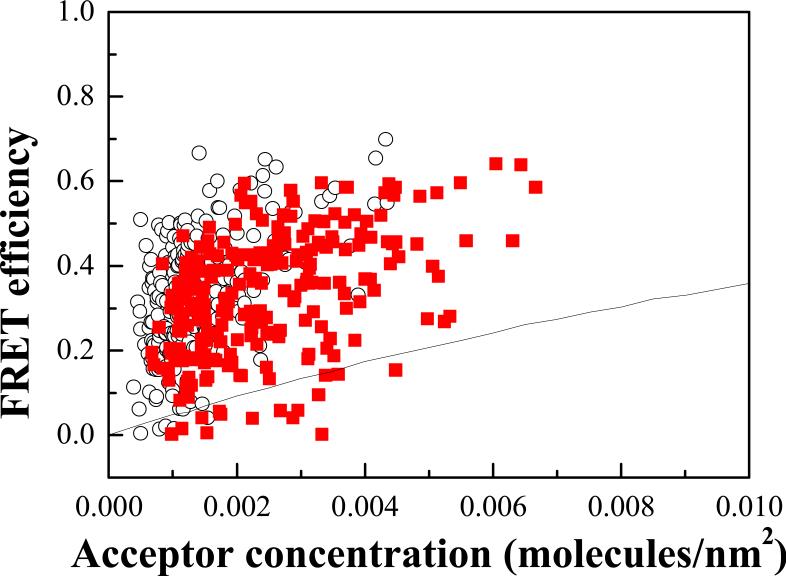
Figure 3.
FRET data and proximity contribution for FGFR3 EC+TM and TM in CHO plasma membrane-derived vesicles. Each data point represents a single vesicle, for which E, CA and CD are determined using the QI-FRET method. Filled squares: FRET efficiencies measured for the FGFR3 EC+TM construct. Hollow circles: FRET efficiencies for the FGFR3 TM construct. QI-FRET data analysis has demonstrated that the scatter is largely due to random noise in image acquisition, and is reducible by collecting a large number of data points 32.

