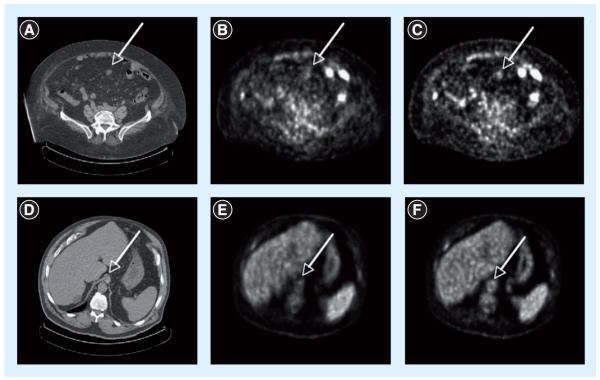
Figure 10. Representative transverse sections of two different patients.
(A–C) Patient with colon cancer (119 kg, BMI = 46.5) shows a lesion (arrows) in abdomen seen in CT much more clearly in the TOF image than non-TOF image. (D–F) Patient with abdominal cancer (115 kg, BMI = 38) shows structure in the aorta (arrows) seen in CT much more clearly in the TOF image than in non-TOF image. Low dose CT (A & D), non-TOF PET with maximum-likelihood expectation-maximization reconstruction (B & E), and TOF PET with maximum-likelihood expectation-maximization reconstruction (C & F).
Reprinted with permission from [83].

