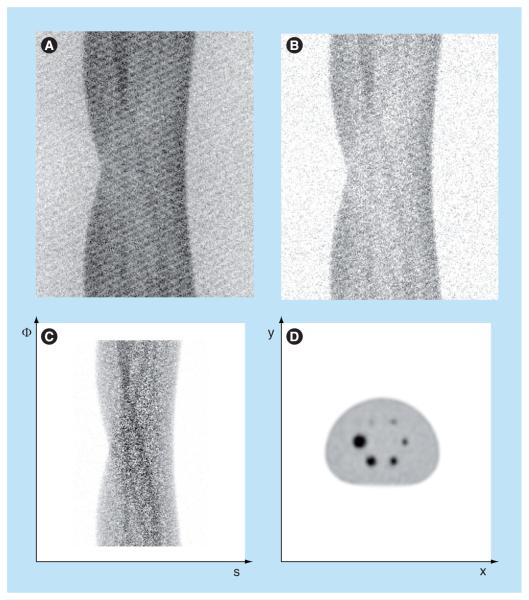
Figure 3. Sinogram example of an image quality phantom.
(A) One oblique plane of 3D sinogram without corrections. (B) Sinogram after scatter and random event corrections. (C) Sinogram after scatter and random corrections, attenuation correction, normalization and deadtime correction. The window level in (C) is 10-times the window level in (A) and (B). (D) One transaxial slice of the image volume reconstructed from the sinogram.

