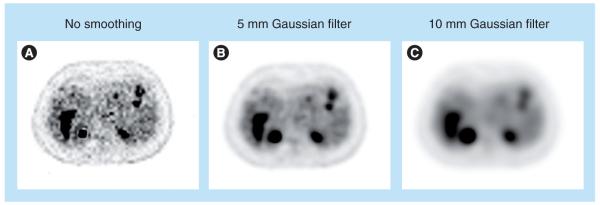
Figure 8. Comparison of ordered subsets expectation-maximization reconstruction of patient data with different smoothing parameters (iteration ten, with ten subsets).
No smoothing (A), a 5 mm Gaussian filter (B) and a 10 mm Gaussian filter are shown. Smoother, but more blurred images are obtained with increasing the amount of postfiltering (A–C).

