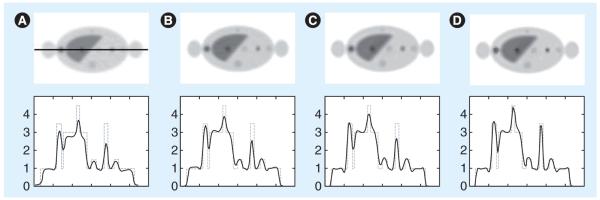
Figure 9. Transaxial slice from simulation of a PET image of the torso.
The second row plots the horizontal profile through the slice with a solid line. Images reconstructed with (A) filtered backprojection, (B) conventional penalized weighted least square, (C) penalized weighted least square with improved system model and (D) penalized weighted least square with improved system model and anatomical prior.
Reproduced from [73].

