
Figure 6.
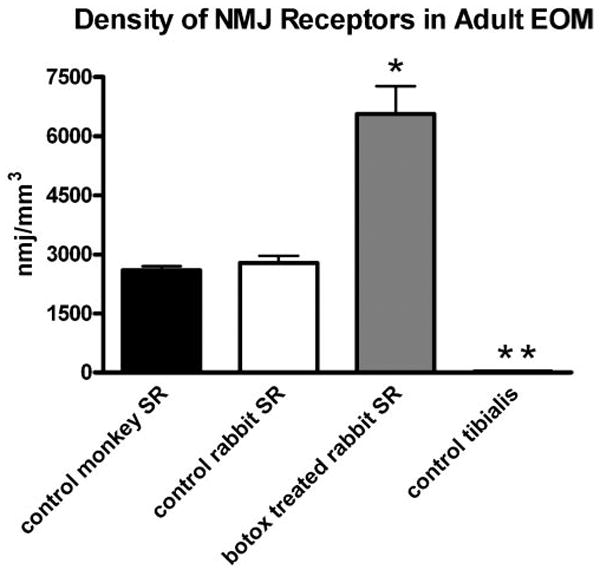
Graph of the mean NMJ density in cubic millimeters in control monkey (black), control rabbit (white), and botulinum toxin–treated (gray) superior rectus (SR) muscles. *Significant difference from control at P < 0.005. **Density is low (18.9 ± 0.54/mm3) and thus is not clearly visible when graphed compared with NMJ density within the normal EOM of rabbit and monkey.