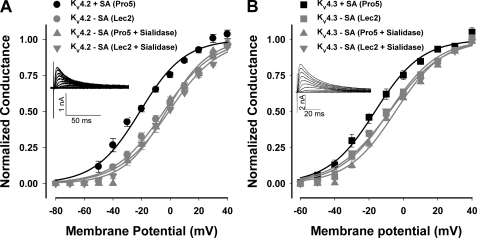
FIGURE 1.
Sialic acids modulate Kv4.2 and Kv4.3 activation. Conductance-voltage (G-V) relationships for Kv4.2 (A) and Kv4.3 (B) under conditions of full (Pro5) and reduced sialylation (Lec2, sialidase-treated Pro5 and Lec2) are shown. Data are the mean normalized peak conductances ± S.E. and are fit to single Boltzmann relationships (lines). Insets, typical whole cell Kv4.2 and Kv4.3 current traces. Black lines/symbols, +sialic acids (Pro5, n = 8–10; circles, Kv4.2; squares, Kv4.3); Gray lines/symbols, −sialic acids (Lec2, n = 11–13 (circles, Kv4.2; squares, Kv4.3); sialidase-treated Pro5 (triangles) or Lec2 (inverted triangles), n = 3–6).

