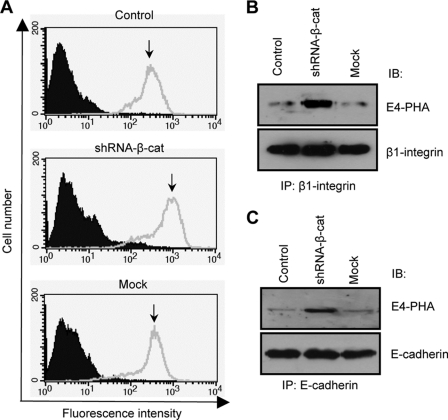
FIGURE 3.
Enhanced expression levels of bisected N-glycans on cell surface and proteins. Cell surface expression levels of bisected N-glycans were examined using FACS analysis. Prior to analysis, cells were incubated with biotinylated E4-PHA lectin, followed by incubation with streptavidin Alexa Fluor 488 conjugate (A). Cell lysates from those three cells were immunoprecipitated using anti-β1 integrin (B) or anti-E-cadherin (C) antibodies. Immunoprecipitates were run on a 7.5% SDS-polyacrylamide gel and probed with the biotinylated E4-PHA lectin. IP, immunoprecipitation; IB, immunoblot.

