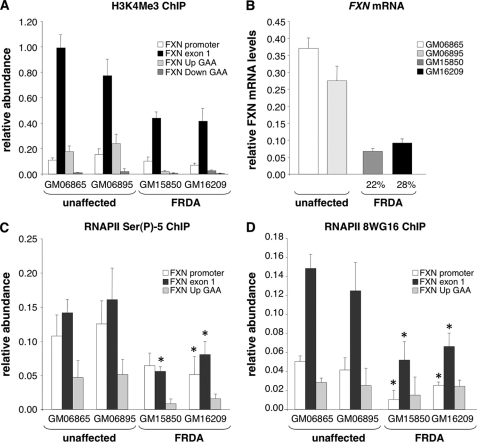
FIGURE 3.
Transcription initiation in FRDA cells. A, the abundance of H3K4Me3 on different regions of the FXN gene in unaffected and FRDA cells relative to its abundance on GAPDH. The differences in the levels of H3K4Me3 in unaffected and FRDA cells were only significant for the exon 1 region (p < 0.05). B, FXN mRNA level in unaffected and FRDA cells relative to GUS. Real-time PCR for FXN mRNA was done with primers exon 3 F and exon 4 R as described previously (3). C, relative abundance of DNA immunoprecipitated with an antibody specific to RNAPII phosphorylated at Ser-5 in unaffected and FRDA cells. The asterisks indicate those regions of patient alleles that are significantly different from the corresponding regions of both unaffected alleles tested at p = 0.05 or better. D, relative abundance of DNA immunoprecipitated by the 8WG16 antibody to RNAPII in unaffected and FRDA cells. The asterisks indicate those regions of patient alleles that are significantly different from the corresponding regions of both unaffected alleles tested at p = 0.05 or better. Error bars in all panels indicate S.D.

