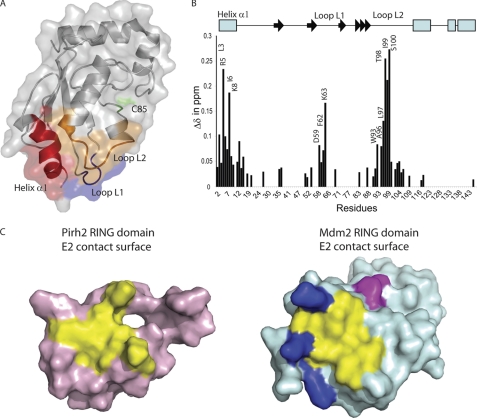
FIGURE 7.
The chemical shift mapping of UBE2D2 upon binding to the Pirh2 RING domain. A, the regions with the greatest chemical shift changes induced upon binding to the Pirh2 RING domain are colored on the transparent surface representation of UBE2D2. The region of helix α1 is colored in red, Loop L1 is blue, and Loop L2 is orange. The catalytic Cys85 is colored in green. B, composite chemical shift changes versus residue number for UBE2D2 upon binding to the Pirh2 RING domain. The values shown were calculated by using the equation, Δcomp = (ΔδHN2 + (ΔδN/5)2)½. The secondary structure elements of UBE2D2 are shown at the top with an arrow for β-strands and a rectangle for α-helices. C, surface representation of Pirh2 (pink) and Mdm2 (pale blue) ring domain, indicating the conserved E2 binding site (yellow) and the extended E2 binding surface of Mdm2 contributed by the positively charged region (blue) and the C-terminal residues from the adjacent subunit (magenta).

