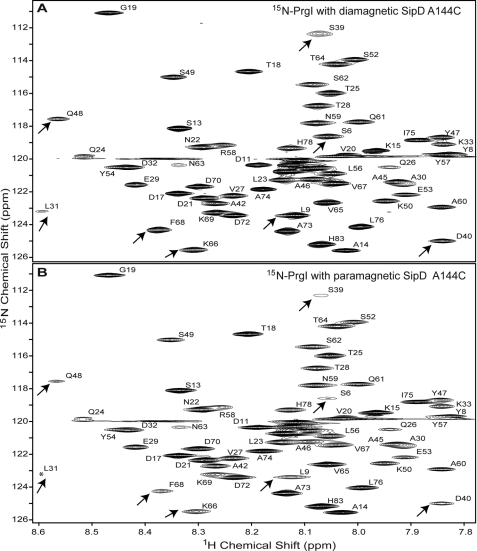
FIGURE 2.
Representative two-dimensional 1H-15N HSQC spectra used in the PRE determination by the single time point method. Shown are the two-dimensional 1H-15N HSQC spectra of 15N-labeled PrgI mixed with unlabeled SipD A144C/C244S double mutant in a 1:1 molar ratio. The SipD used was without the MTSL spin label (A) and with the MTSL spin label (B). The assignments of PrgI were published previously (9). Some peaks that showed reduced intensities from the paramagnetic effect are indicated by arrows. The two spectra are shown at identical contour levels, and the peak for Leu-31 in B (marked by an asterisk) appeared at a lower contour level.

