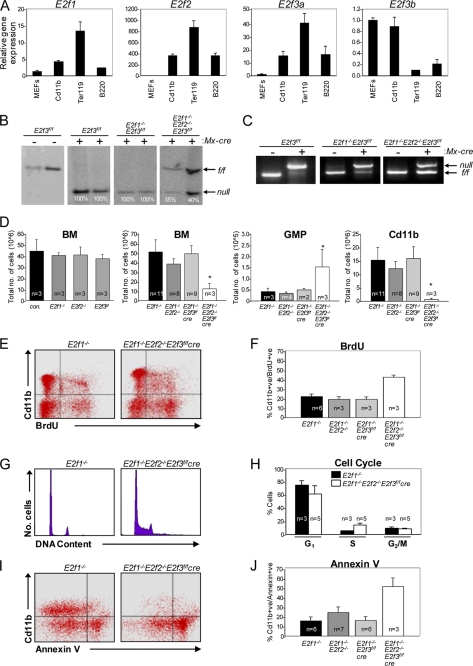
FIGURE 1.
E2f1–3 are essential for myeloid development. Analysis of BM cells isolated from 8–10-week-old mice 2 weeks after pIpC treatment. A, real-time PCR analysis of expression of E2f1, E2f2, E2f3a, and E2f3b in FACS-sorted cells of different hematopoietic lineages. Bone marrow cells were isolated and stained with lineage-specific antibodies (Cd11b, Ter119, and B220) and sorted by FACS. Real-time PCR was then performed on RNA isolated from these sorted cells. B, Southern blot on genomic DNA isolated from BM of Mx-cre E2f3f/f, E2f1−/−E2f3f/f, and E2f1−/−E2f2−/−E2f3f/f mice. A minimum of three samples were analyzed from each genetic group. Two representative samples analyzed from each genetic group are shown. C, E2f3 PCR genotyping on genomic DNA isolated from BM of Mx-cre E2f3f/f, E2f1−/−E2f3f/f, and E2f1−/−E2f2−/−E2f3f/f mice. D, analysis of cells isolated from femur of mice of the indicated genotype showing bone marrow cellularity (p < 0.0003), number of granulocyte-macrophage progenitors (GMP) (p < 0.018), and number of CD11b+ myeloid cells (p < 0.0002). Values are mean ± S.D. (error bars). E, FACS profile of CD11b+ myeloid cells stained with α-BrdU antibody to determine the number of cells in S phase. F, quantification of CD11b+ BrdU-positive cells; values are mean ± S.D. (p < 0.0008). G and H, analysis of DNA content in CD11b+ cells by propidium iodide staining. Values are mean ± S.D. (p < 0.003). I, representative FACS profile of myeloid cells stained with apoptotic marker annexin V. J, quantification of CD11b+ apoptotic cells. Values are mean ± S.D. (p < 0.005).

