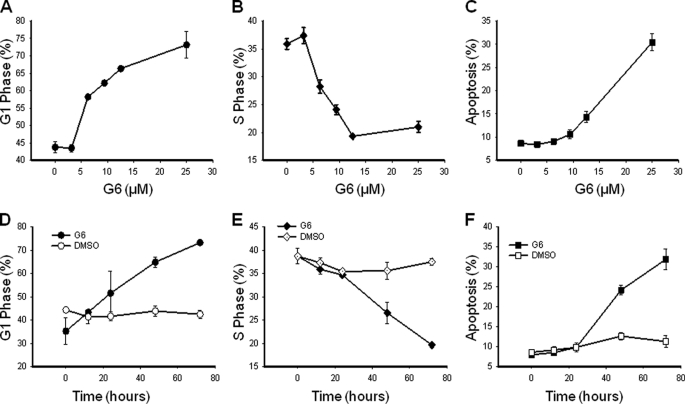
FIGURE 2.
G6 suppresses HEL cell growth by inducing G1 phase cell cycle arrest. HEL cells were treated with increasing doses of G6 for 72 h or with 25 μm G6 for increasing times. Cellular DNA contents were then determined by flow cytometry. Three independent experiments, each measured in triplicate, were averaged and the aggregate cell cycle data were graphed as a function of G6 concentration (A–C) or G6 exposure time (D–F). Shown are the percentage of cells in G1 phase (A and D), S phase (B and E), and apoptosis (C and F). Shown are mean ± S.E.

