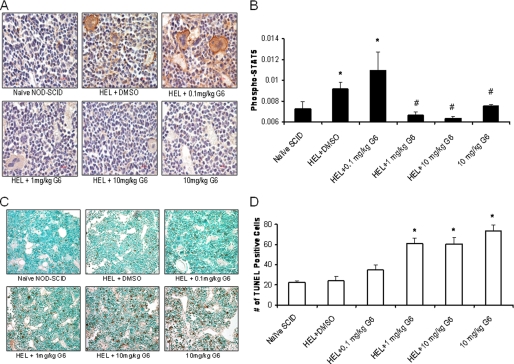
FIGURE 7.
G6 reduces the levels of phospho-STAT5 and induces cellular apoptosis in the bone marrow. A, representative anti phospho-STAT5 immunohistochemistry bone marrow sections from the indicated treatment groups. B, anti-phospho-STAT5 staining was quantified and plotted as a function of treatment group. *, p < 0.05 versus naïve; #, p < 0.05 versus HEL+DMSO. C, representative TUNEL stained bone marrow sections from each treatment group. D, bone marrow TUNEL-positive cells were counted and plotted as a function of treatment group. *, p < 0.05 versus HEL+DMSO.

