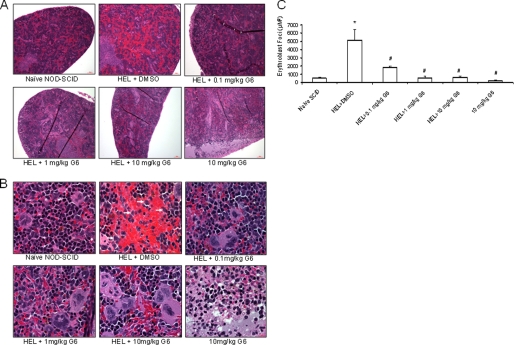
FIGURE 8.
G6 treatment results in neoplastic regression and normalization of hematopoiesis in the spleen. Histological sections of the spleen were prepared from each treatment group and viewed at 10× magnification (A) and 100× magnification (B). Injection of HEL cells resulted in the appearance of neoplastic cells in the spleen (arrowheads in panel B) and this was reduced with G6 treatment. C, number of erythroblast foci were counted and plotted as a function of treatment group. *, p < 0.05 versus naïve; #, p < 0.05 versus HEL+DMSO.

