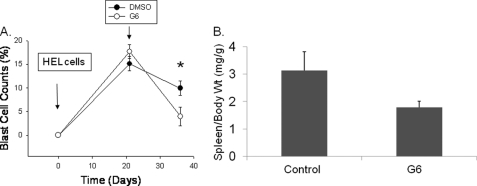
FIGURE 9.
Therapeutic indicators of G6 efficacy correlate with the present of G6 in the plasma, marrow, and spleen. A, percentages of blast cells in the peripheral blood plotted as a function of both treatment group and time. *, p < 0.05 versus DMSO-treated mice. B, spleen to body weight ratio was obtained and plotted as a function of treatment group.

