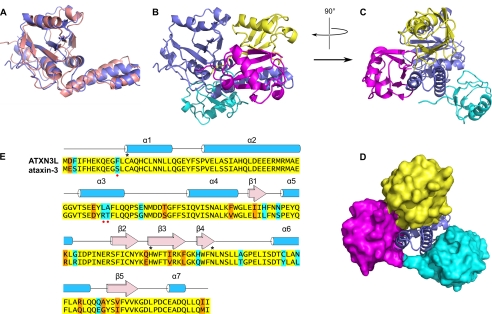
FIGURE 5.
Comparison of the ataxin-3 and ATXN3L Josephin domain structures. A, superposition of the ATXN3L crystal structure (blue) and free ataxin-3 solution structure (pink; PDB entry 1YZB). Panels A and B are oriented essentially similarly to Fig. 3, A and B. B, comparison of the ubiquitin binding modes of ATXN3L and ataxin-3. The ataxin-3 complex with ubiquitin (PDB entry 2JRI) was superposed on the ATXN3L-ubiquitin complex, aligning the Josephin domains; for simplicity's sake, only the ATXN3L Josephin domain is shown (blue). The ubiquitin molecule seen in the ATXN3L crystal structure is shown in yellow, and the two ubiquitin molecules found in the ataxin-3 solution structure are shown in magenta and cyan. The magenta molecule binds near the Josephin active site, and the cyan molecule binds in the HHR23 site. C, orthogonal view of the same superposition seen in Panel B is shown. D, shown is the same view as in panel C, but with the ubiquitin molecules shown in surface representation. E, sequence alignment of the ataxin-3 and ATXN3L Josephin domains is shown. Identical residues are highlighted in yellow, conservative differences are highlighted in orange, and non-conservative differences are highlighted in cyan. Residues of the active site triad are marked with asterisks. Red dots mark the three residues that, when mutated, increase ataxin-3 activity.

