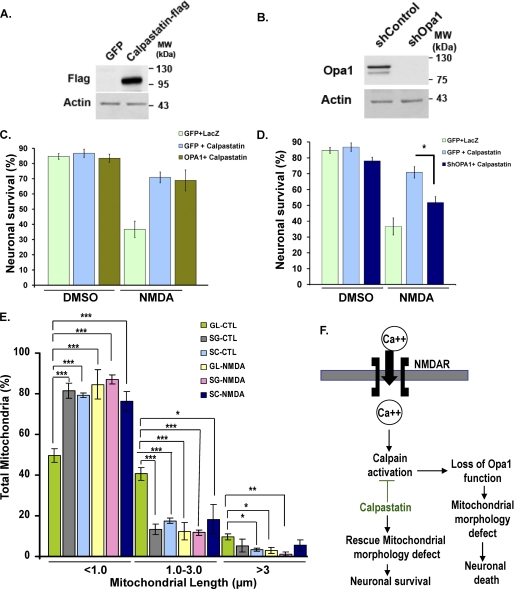
FIGURE 7.
Opa1 functions downstream of calpain activation. A, neurons were infected with adenoviruses carrying FLAG-tagged calpastatin or GFP control at 5 DIV. Cell lysates were collected at 8 DIV, and the expression levels were analyzed by an antibody against FLAG. Actin was used as a loading control. B, neurons were infected with adenoviruses carrying ShOpa1 or control (shControl). Cell lysates were collected at 8 DIV, and the expression levels were analyzed by an antibody against Opa1. Actin was used as a loading control. C and D, neuronal survival was plotted in neurons co-expressing control vectors alone (GFP + LacZ), calpastatin alone (GFP + Calpastatin), calpastatin and Opa1 (Opa1 + Calpastatin) or calpastatin and ShOpa1 (ShOpa1 + Calpastatin) at 0 and 24 h following treatment with NMDA. Infectivity (MOI) was equalized using control vectors GFP and LacZ. The results were compared with control neurons expressing LacZ + GFP. E, mitochondrial length was quantified in Opa1-depleted neurons (ShOpa1) and compared with the GFP control group in the absence (LacZ) and presence of calpastatin without and with NMDA. SG, ShOpa1 + GFP; SC, ShOpa1 + calpastatin; GL, GFP + LacZ (control). Three independent experiments (n = 3) are shown. *, p < 0.05; **, p < 0.01; ***, p < 0.005. F, our present model proposes that Opa1 functions downstream of calpain to regulate mitochondrial morphology and neuronal survival following calcium influx associated with excitoxicity. Error bars, S.D.; CTL, control.

