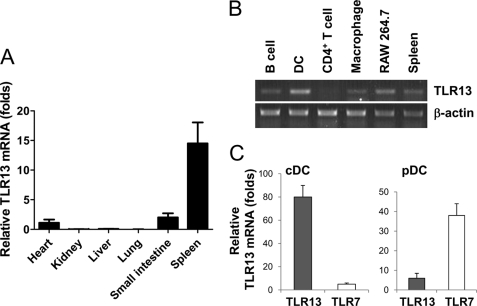
FIGURE 1.
Characterization of TLR13 expression profile. A, real-time RT-PCR analysis of TLR13 mRNA expression in various mouse organs is shown. The graph shows the mean ± S.D. of three independent experiments. B, shown is RT-PCR of TLR13 expression in various cell types in spleen, including B and CD4+ T lymphocytes, DCs, macrophages. Single-cell suspensions of splenocytes were sorted by FACS. β-Actin was used as a control. C, shown is quantitative RT-PCR analysis of TLR13 and TLR7 mRNA expression in pDCs and cDCs.

