Figure 1.
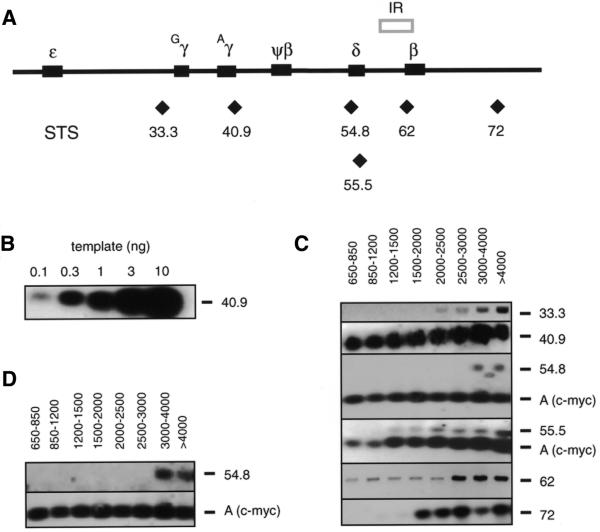
PCR mapping of nascent DNA strands. (A) Map of the human globin gene locus. Solid boxes represent the position of the globin genes. The previously described IR (5) is shown above the map. Diamonds indicate the approximate position of the STSs/primer sets used in the PCR mapping of nascent strands and the nascent strand abundance assay. (B) Genomic DNA titration. Autoradiogram following PCR amplification of increasing amounts of genomic DNA with STS 40.9 primers. (C) Autoradiograms of size fractionated nascent DNA amplified with each of the STS primer pairs, hybridized to the cognate internal probes. The approximate sizes of the nascent DNA fractions used in each reaction are indicated above each lane. STSs are shown on the right. STS A, which is within the human c-myc origin, was included as an internal standard in some experiments. (D) Nascent DNA from the same preparation that had been co-amplified by primers STS A and STS 54.8 in (C) was amplified in separate reactions by the same primers. Note that the band below the STS 54.8 product in (C) is an artifact that does not reappear when the same DNA is amplified in the experiment of (D).

