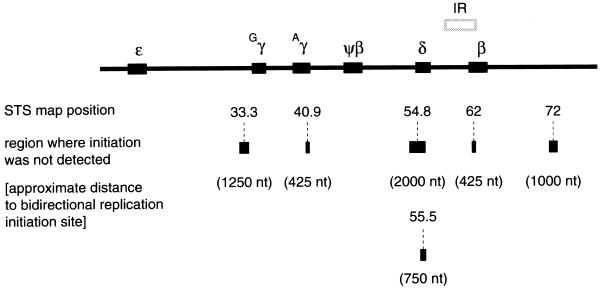
Figure 2.
Summary of the PCR mapping of nascent DNA strands. STSs used in the PCR amplification are shown below the globin locus map. The bar centered below each STS indicates the maximum distance to an initiation zone. The deduced distance (in nucleotides) to the nearest initiation site assuming equivalent rates of bidirectional fork movement is also shown.

