Figure 3.
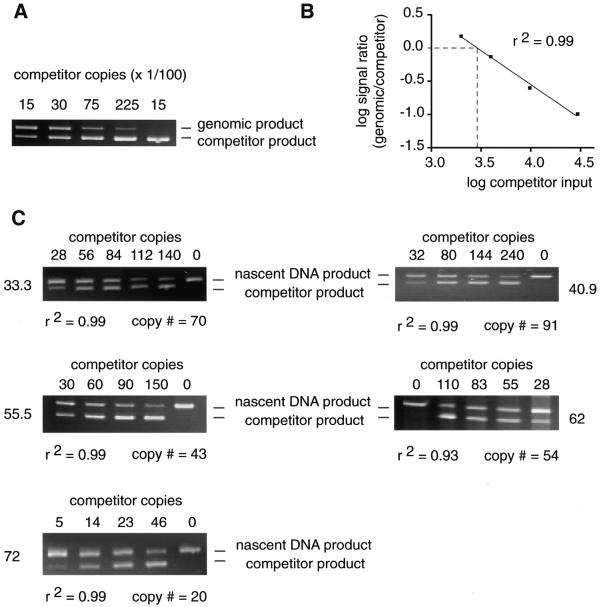
Competitive PCR quantitation. (A) A constant amount of genomic DNA (3000 copies) was amplified with 1500, 3000, 7500 or 22 500 copies of the STS 40.9 competitor template. Rightmost lane, no genomic DNA. (B) The logarithm of the signal intensity ratio of genomic to competitor products is plotted against the logarithm of the number of input competitor copies. The quantity of competitor equivalent in amplification efficiency to 3000 copies of genomic DNA corresponded to the value interpolated from the experimental curve when the logarithm of the signal intensity ratio equaled 0. (C) Representative gels of competitive PCR quantitation of short nascent DNA at five STSs. The number of competitor molecules added to each reaction is shown above each lane. The positions of the nascent and competitor PCR products on the gel are indicated. The number of nascent strand copies at each STS was calculated by plotting the logarithm of the signal intensity ratio of the products against the logarithm of the amount of competitor added and is shown below each gel. The coefficient of determination for each data set, r2, is also indicated.

