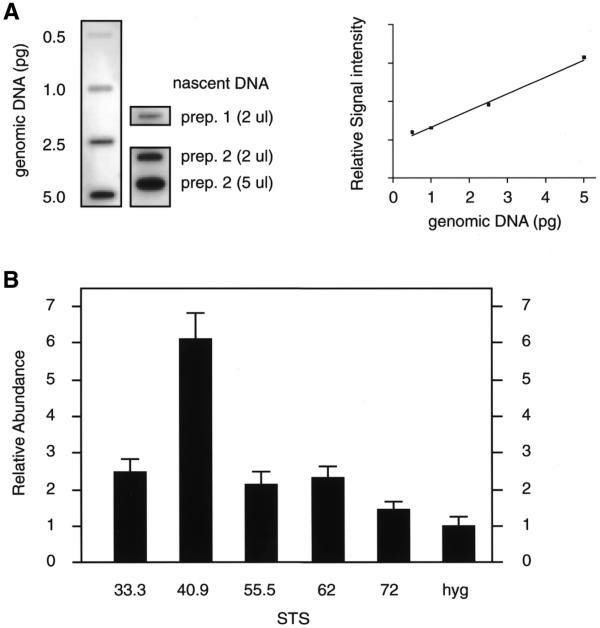
Figure 4.
Summary of the nascent strand abundance assay. (A) Autoradiogram of genomic and nascent DNA (prep. 1, BrdUrd labeled; prep. 2, alkaline gel isolate) slot blotted and hybridized to total genomic DNA (left). The amount of nascent DNA in different preparations was normalized by comparison with the genomic DNA standard curve generated by PhosphorImager analysis (right) (20). (B) The nascent DNA abundance at each STS is plotted relative to the abundance at STS hyg. STS hyg is a randomly integrated target site present once per genome, used previously for the analysis of the human c-myc origin (20). The nascent strand abundance was normalized for the copy numbers of the globin and STS hyg loci per genome. Error bars, standard deviation. The results are the average of four to six separate experiments obtained from three different nascent DNA preparations.

