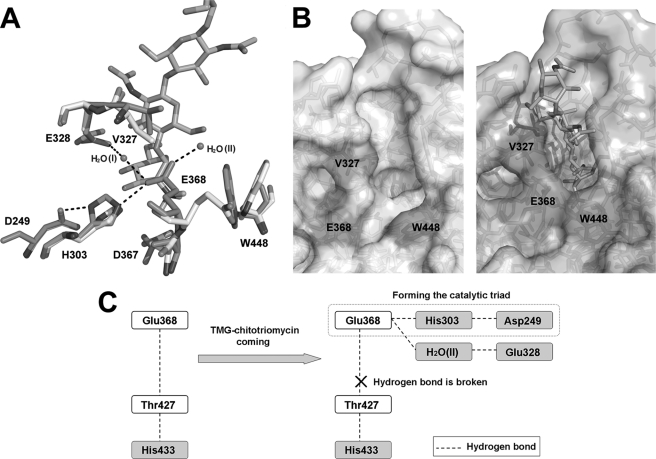
FIGURE 5.
Conformational changes induced by inhibitor binding at the active site. A, conformational changes of +1 subsite residues (Val327 and Glu328) and −1 subsite residues (His303, Asp367, Glu368, and Trp448) and two hydrogen bond networks (Asp249–His303–Glu368 and Glu328–H2O(I)–Glu368) are shown. The spatial arrangements of these residues before and after TMG-chitotriomycin binding are shown in white and blue, respectively. The hydrogen bond networks are shown in black dashes. B, open and closed states of the active pocket. C, model explaining the changes in the coupling effects of the hydrogen-bonding network induced by inhibitor binding at the active site.

