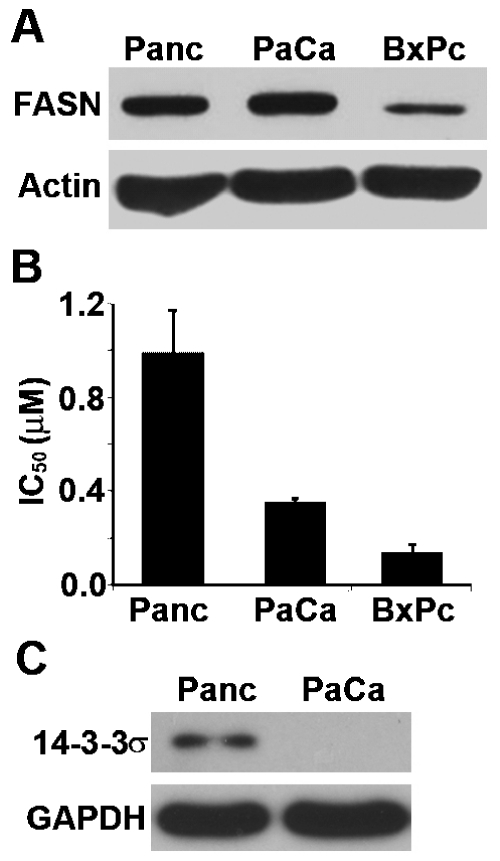
Figure 3.
Correlation between FASN expression and gemcitabine resistance. A. FASN expression level in Panc-1, MiaPaCa-2, and BxPc-3 cells. Lysates from Panc-1, MiaPaCa-2, and BxPc-3 cells were prepared for Western blot analyses of FASN and actin loading control. B. IC50 of gemcitabine. The effect of anticancer drug gemcitabine on the survival of Panc-1, Mia-PaCa-2, and BxPc-3 cells was determined using MTT assay and IC50 was determined using Prism program. C. 14-3-3σ expression level in Panc-1 and MiaPaCa-2 cells. Lysates from Panc-1 and MiaPaCa-2 cells were prepared for Western blot analyses of 14-3-3σ and GAPDH loading control.

