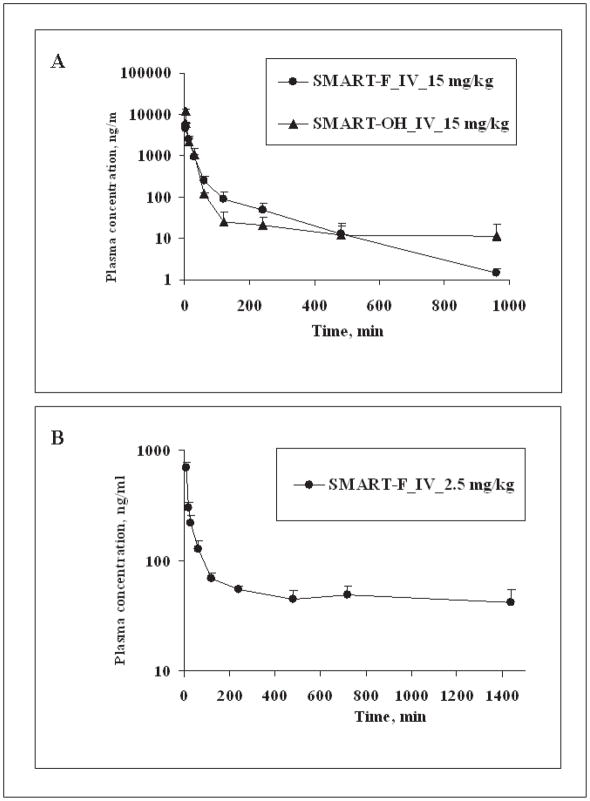
Figure 3.
Pharmacokinetic studies of SMART-F, and -OH in mice and rats. (A) Concentration-time curve of SMARTs in ICR mice (n = 3); bars, SD. SMARTs were administrated 15mg/kg i.v. by tail vein injection. (B) Concentration-time curve of SMART-F in SD rats (n = 4); bars, SD. SD rats were dosed 2.5 mg/kg i.v. with the formulation DMSO/PEG300 (1/4). The pharmacokinetic data for SMART-H are shown for comparison, and were previously presented in Li et al. (Drug Metabolism and Disposition 2010).

