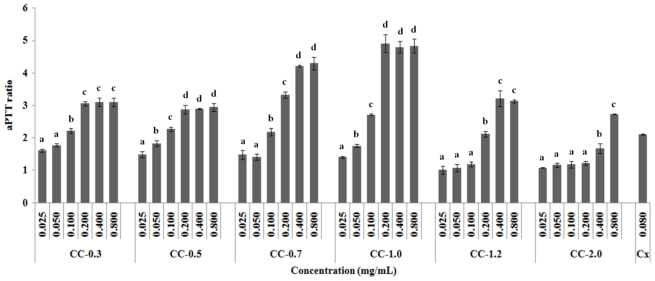
Figure 1.
Anticoagulant activity by aPTT test. Results were expressed as aPTT ratio, obtained by dividing clotting time achieved with the anticoagulant by that obtained with the control. Data are expressed as means ± standard deviation of four determinations; a,b,c,d Different letters indicate a significant difference between each concentration of the same sulfated polysaccharide using one-way Anova followed by the Student-Newman-Keuls test (p < 0.05). Cx: Clexane®.

