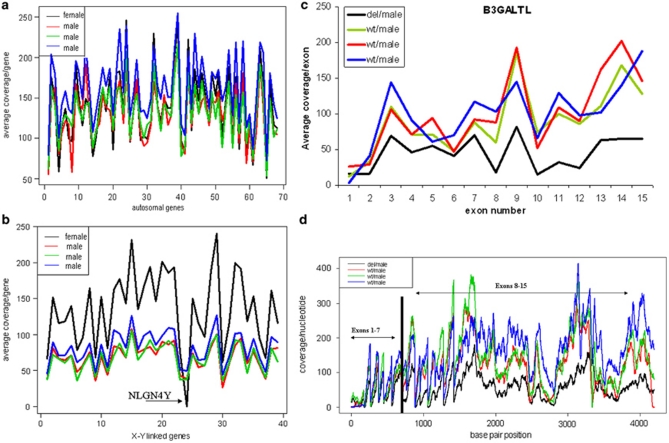
Figure 2.
Average coverage obtained for different genes in four different samples. (a) Shows average coverage of 69 autosomal genes from four different samples. (b) Shows average coverage of 39 genes located on X and one gene (NLGN4Y) located on the Y chromosome; a female sample exhibited an absence of hybridization on the captured array, with no coverage in the regions corresponding to the NLGN4Y. The female sample shows a higher average coverage per gene for all genes located on X-chromosome compared with male samples. (c) Lower average coverage of B3GALTL gene in a male patient sample with a known large deletion compared with three wild-type male samples. (d) Coverage per nucleotide/position for the whole B3GALTL gene: the patient sample shows lower coverage for the second half (exons 8–15) compared with wild type samples. del=deletion, wt=wild type.

