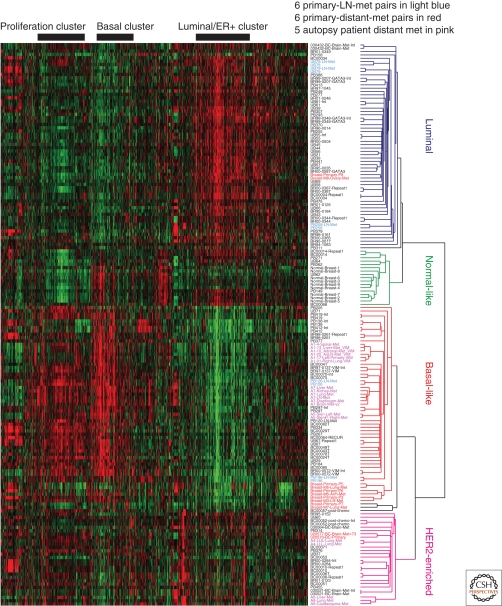
Figure 2.
Hierarchical clustering analysis of primary tumors and metastases taken from Weigelt et al. (2005) and reproduced with permission from AACR Publications © 2005. A hierarchical clustering analysis was performed using a 1300-gene intrinsic gene list from Hu et al. (2006). Genes were arranged in horizontal and samples in vertical. Sample names in red represent six primary tumor-distant metastasis pairs; those in light blue represent primary tumor-lymph node metastasis pairs; and those in pink represent local and distant metastasis samples from autopsy patients (which for patient A1 includes the primary).

