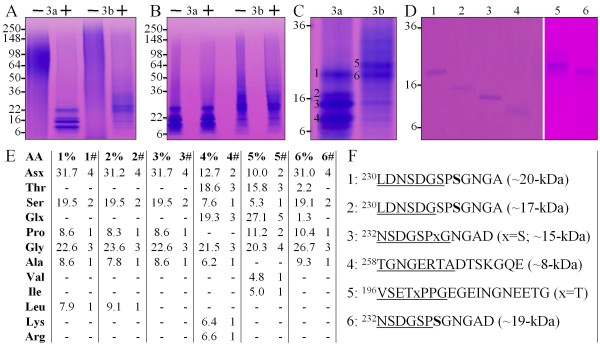
Figure 2.
Characterization of small, highly glycosylated Dsp peptides. A: 4-20% Tris/glycine gel stained with stains-all showing fraction ANS1/2R3-a and -b before (-) and after (+) digestion with chondroitinase ABC. The stains-all positive proteoglycan smears coalesced into a group of protein bands having apparent molecular weights ranging from 8 to 20-kDa. B: 4-20% Tris/glycine gel stained with stains-all showing fraction ANS1/2R3-a and -b without (-) and with (+) the reducing agent β-mercaptoethanol. The mobilities of the bands did not change indicating the absence of disulfide bridges. C: 4-20% Tris/glycine gel stained with stains-all showing the bands from ANS1/2R3-a (3a) and ANS1/2R3-b (3b) following chondroitinase ABC digestion that were excised from the gel and characterized by amino acid analysis and N-terminal sequencing. D: 18% Tris/glycine gel stained with stains-all showing the bands following electroelution. E: Results of amino acid analyses showing the percentage (%) of each amino acid in the 6 peptides and the deduced numbers (#) of each amino acid. The percentages were converted into number of amino acids by dividing all of the percentages by the lowest meaningful percentage, which corresponded to the percentage of a single amino acid. F: The complete sequences of each peptide. The Edman sequences are underlined with blank cycles indicated by an "x".

