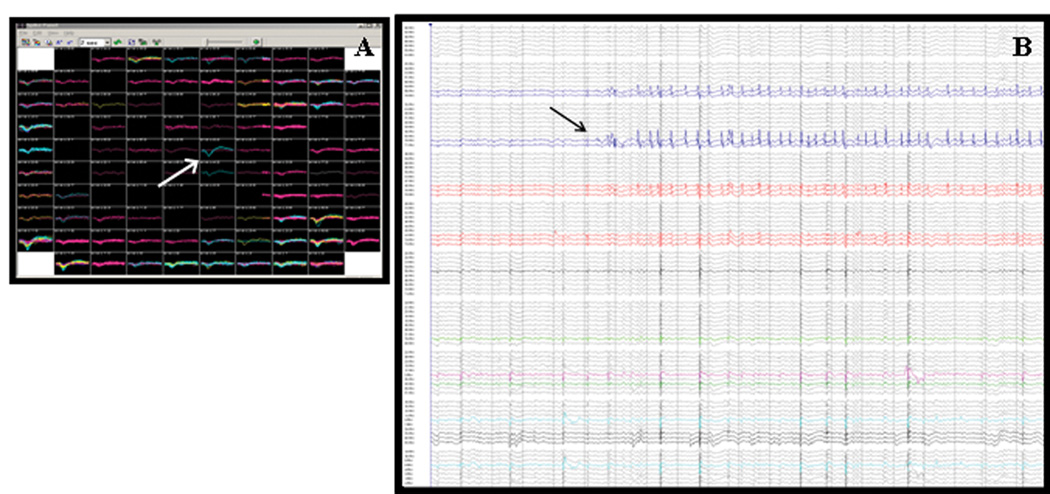
Figure 2.
A) Screenshot from the real-time data montage for a single NeuroPort™ microarray, depicting unit activity (arrow) recorded during a two-second period. Each individual box represents activity recorded from a single microelectrode. Two-dimensional relationships between electrodes are equivalent to their physical positioning within the array. B) Local field potential activity recorded during a typical 10-second period. The arrow points to a “microseizure”, restricted to only eight electrodes. Local field potentials were recorded from over 80% of the microelectrodes in this array.

