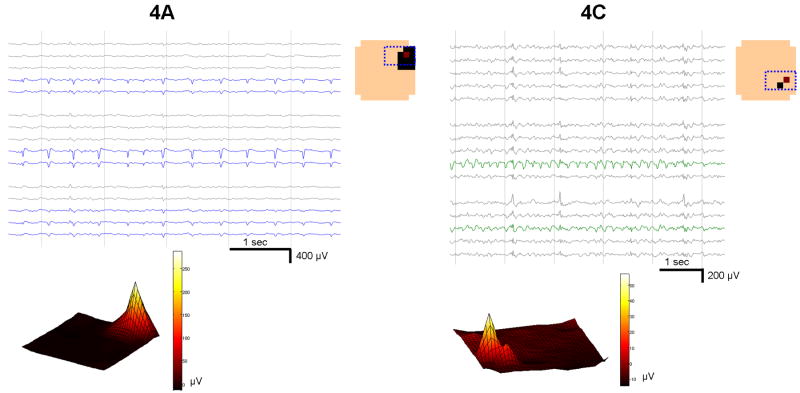
Figure 1. Microdischarge fields recorded by the MEA.
Two populations from Patient 4 (4A and 4C) are shown, displaying stereotyped but distinctive location, fields, and waveshape. The μEEG in a subset of the MEA, shown in the channel layout schematic in the upper right enclosed in a dotted blue box, is displayed. Channels within the discharge field are indicated by colored traces. Averaged instantaneous amplitude of all 100 discharges in each population at the time of the reference channel peak (tmax) is shown on the physical MEA layout (color spectrum plots, bottom). Channels meeting criteria for inclusion in the field are shown in the layout schematic as solid squares, with the red square denoting the primary channel. In both the averaged and the individual waveform views, there is an abrupt transition between channels within and outside of the discharge field that does not follow a symmetric spatial pattern. In particular, the population in 4C is maximal in channels that are not immediately adjacent.

