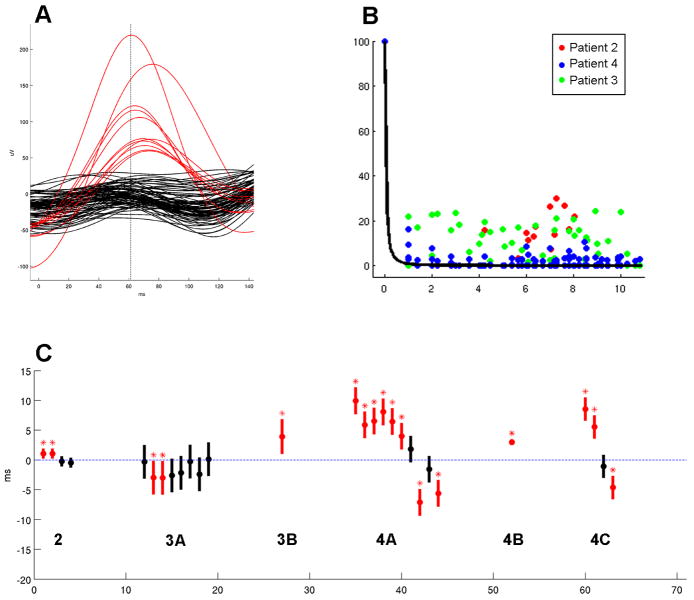
Figure 3. Evidence against the volume conduction hypothesis for dense intracortical recordings.
A) Simultaneous μEEG traces during a single microdischarge from Patient 4, with channels within the discharge field shown in red and the remaining channels in black. Note the lack of an even gradation of voltage that would be expected if waveform amplitude is continuously dependent on distance from the discharge source. B) Amplitude lower envelope, color coded according to patient, showing a uniform distribution with respect to distance. No significant difference in means was found between the channels nearest to the source (<= 3) and those farthest away (>= 9) (one-way ANOVA, alpha of 0.05). Superimposed on these is a 1/xˆ2 curve (Equation 1), which best explains the observed values and illustrates the steep drop-off of 1/xˆ2. C) Averaged peak timing of each field channel relative to the primary channel, arranged by population. Negative values indicate that the peaks in these channels preceded that of the primary channel, and positive values indicate a lag. Mean peak delays are indicated by the solid circles, and standard deviation by the vertical bars. Mean values that are significantly different from zero (blue dotted line) are shown in red and marked with an asterisk (one-way ANOVA with Bonferroni correction, p < 0.001).

