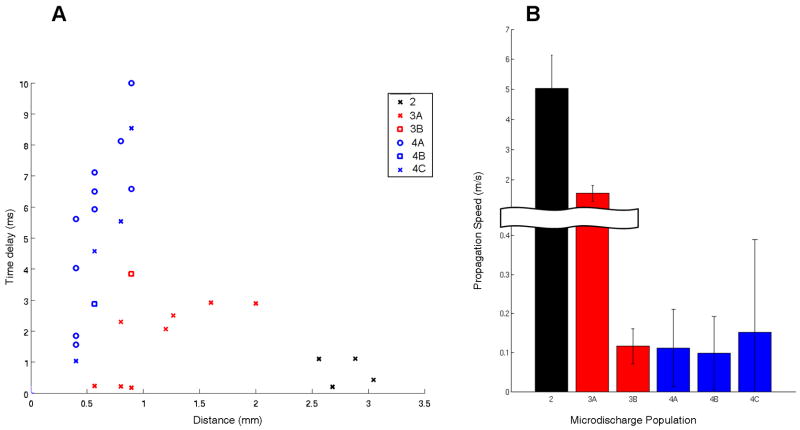
Figure 4. Estimation of propagation speed.
A) Absolute values of the average peak time lead or lag per channel in each microdischarge field is plotted against the distance from the primary channel, with color and symbol used to code for patient and discharge population. B) Bar plot showing the mean and standard deviation of propagation speeds in meters per second, calculated for each population. Mean speeds ranged from 100 mm/sec (population 4B) to 5 m/sec (population 2). The observed variation suggests that local propagation speed is highly dependent on the structure of the underlying neural architecture.

