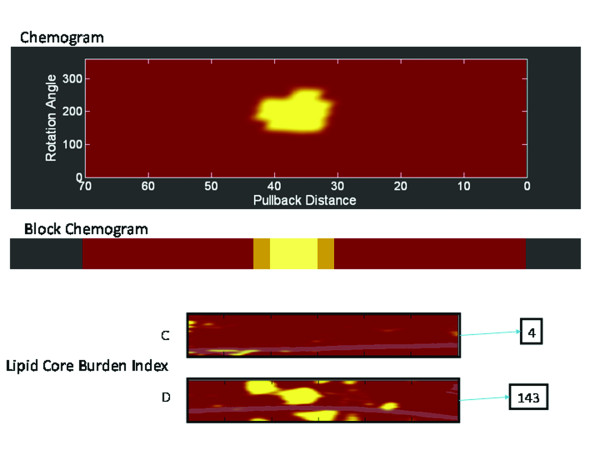
Figure 4.
The outputs from the Near-infrared spectroscopy device. (A) The chemogram is a map of the measured probability of the presence of lipid core plaque from each scanned arterial segment and displays pullback position against circumferential position of the measurement in degrees. The device attributes a yellow colour to those regions with the highest probability of lipid core plaque, whilst red represents those with the lowest. In this example, a high probability of lipid core is detected at 30-40 cm proximal to the origin of the pullback. (B) A block chemogram provides a summary of the raw data from the chemogram and displays the probability that a lipid core is present for all measurements in a 2 mm block of coronary artery. The order of probability for the presence of lipid core plaque from highest to lowest is yellow, light brown, brown, and red. (C and D) The lipid core burden index, a numerical value, which ranges from 0-1000, gives an impression of the lipid content within the artery. The chemogram (C) has very little in the way of yellow regions, compared to the chemogram (D), reflecting this, the respective lipid core burden indexes are 4 and 143.

