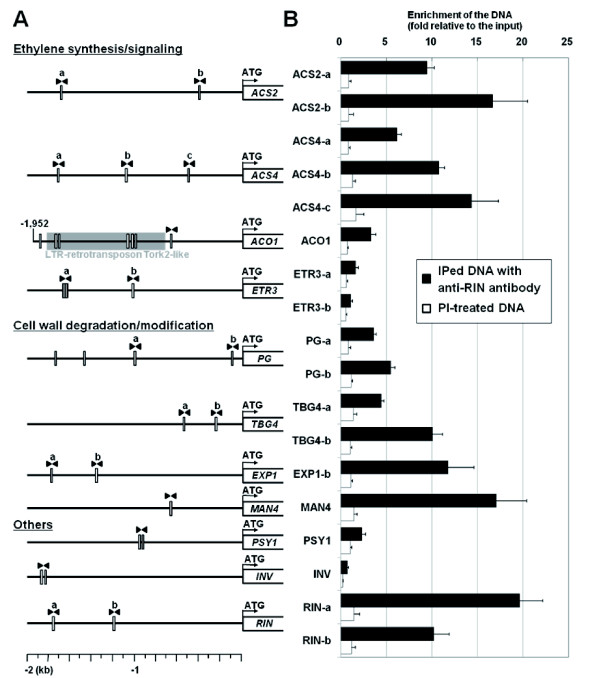
Figure 1.
CArG-box sites in the ripening-associated gene promoters and their enrichment in ChIP-DNA. (A) Position of CArG-box sites (indicated by thin rectangles) found in the 2-kb potential promoter regions of the ripening-induced genes. A pair of primers specific to each site is indicated by pairs of filled arrowheads. When two or more sites exist in the same promoter, they are distinguished by the lower-case letters (a, b) above them. (B) Enrichment test of the CArG boxes. Bars represent the relative DNA amount of CArG boxes in IPed DNA recovered using either anti-RIN antibody or pre-immune serum (PI) to those in the total input chromatin DNA. (Note that the result of EXP1-a is omitted due to inadequate amplification efficiency in the real-time PCR analysis.) Data are the means from three independently prepared IPed DNAs. Error bars indicate standard error of each mean.

