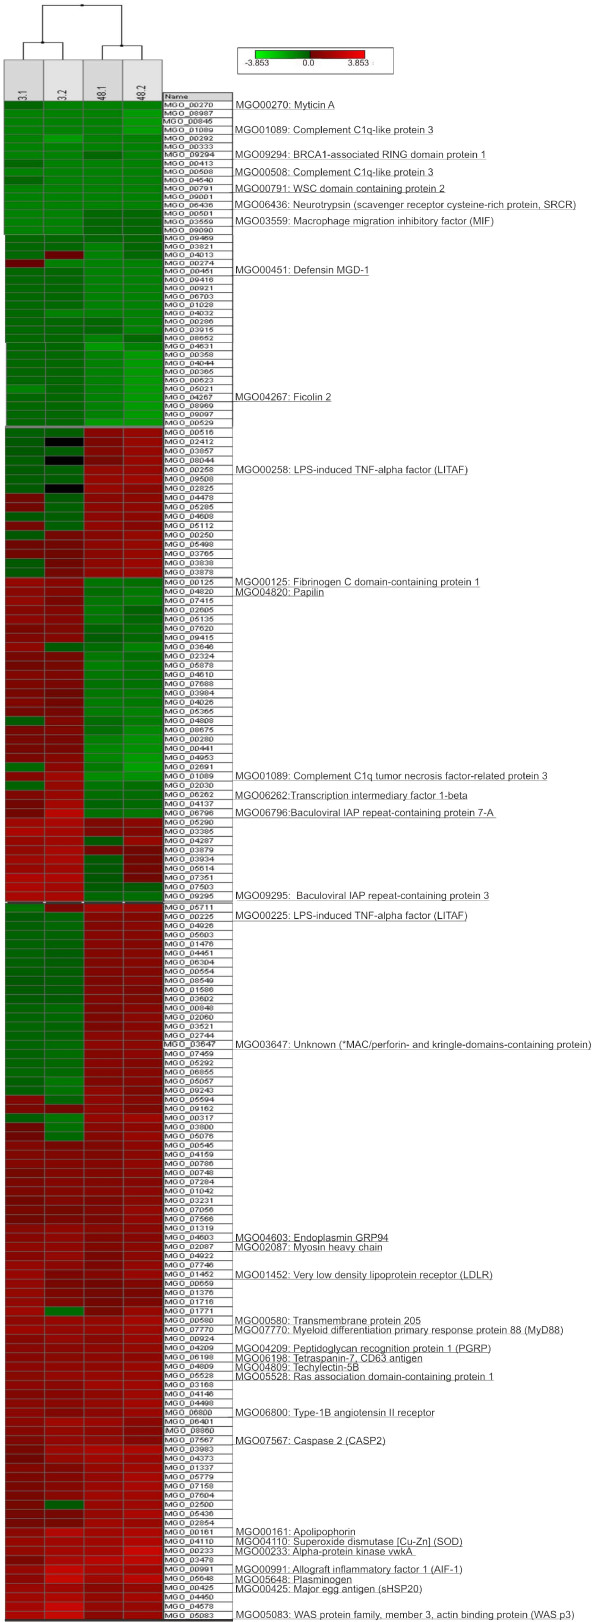
Figure 4.
Hierarchical clustering of the Immunochip profiles referring to 3 and 48 h post-injection of live V. splendidus. Two mussel groups with 8 replicates per time point have been analyzed (R-package software). Scale of the expression values and probe ID are indicated. For space reasons, only instructive parts of the clustered data are reported.

