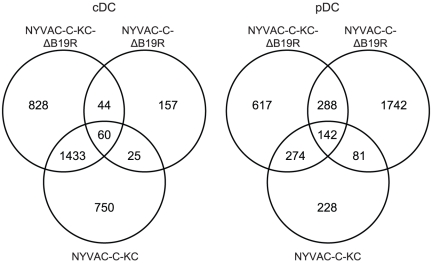
Figure 3. Venn diagram of the number of common and unique genes in cDCs and pDCs after infection with NYVAC-C and its mutants.
Venn-diagrams showing the numbers of genes that are up- and down-regulated in cDCs (left panel) and pDCs (right panel) after infection with NYVAC-C-ΔB19R, NYVAC-C-KC or NYVAC-C-KC-ΔB19R. In cDCs 157, 750 and 828 genes are uniquely differentially expressed (p<0.05) in NYVAC-C-ΔB19R, NYVAC-C-KC and NYVAC-C-KC-ΔB19R, respectively. In pDCs 1742, 228 and 617 genes are uniquely differentially expressed (p<0.05) in NYVAC-C-ΔB19R, NYVAC-C-KC and NYVAC-C-KC-ΔB19R, respectively. For each gene, the expression induced by NYVAC-C-ΔB19R, NYVAC-C-KC or NYVAC-C-KC-ΔB19R was tested for differential expression by comparison to the expression induced by NYVAC-C (n ranges between 2 and 18).

