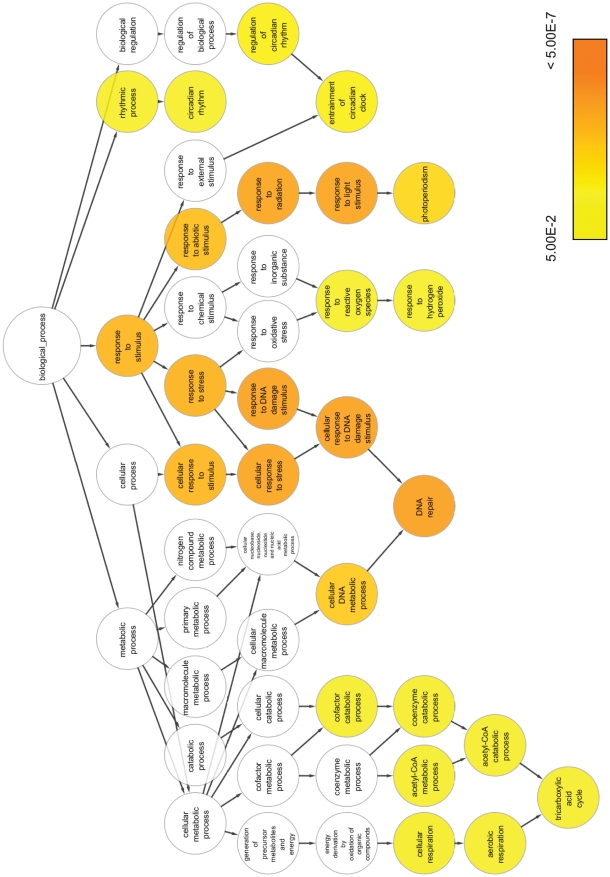
Figure 4. Gene Ontology hierarchy and enrichment statistics for the biological process ontology.
GO terms within the biological process ontology that are significantly enriched (adjusted p≤0.05) in the light induced gene set are indicated in colour, with the colour shade corresponding to the enrichment p-value.

