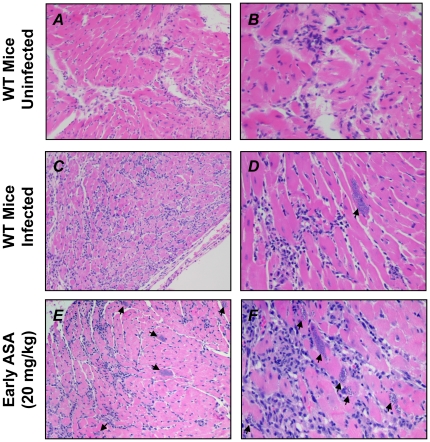
Figure 3. Cardiac pathology in ASA-treated mice is no different to vehicle treated controls.
Representative histopathology of infected CD-1 mice with and without ASA treatment (20 mg/kg) at 35 dpi compared with uninfected controls. Sections were stained with H&E. Parasite pseudocysts are observed (arrows). Total magnification of either 100× (A, C, E) or 400× (B, D, F). Images are representative of al least five mice in each group.

