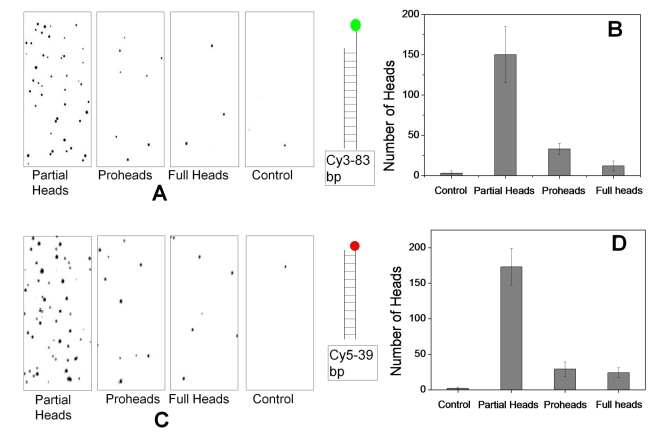
Figure 6. Single molecule fluorescence measurements of refilled heads.
Quantification of packaging by single molecule fluorescence assay. See Materials and Methods for details. (A and C) Fluorescence images of immobilized T4 heads packaged with Cy3 (83-bp) and Cy5 (39-bp) DNAs, respectively. One-fourth of the 70 µm ×35 µm imaging area is shown in each case (see Figures S1 and S2 for full-size fluorescent images). (B and D) Histograms showing the number of heads packaged with Cy3 or Cy5 DNAs. The number of heads showing fluorescence in more than 30 images was averaged in each case.

