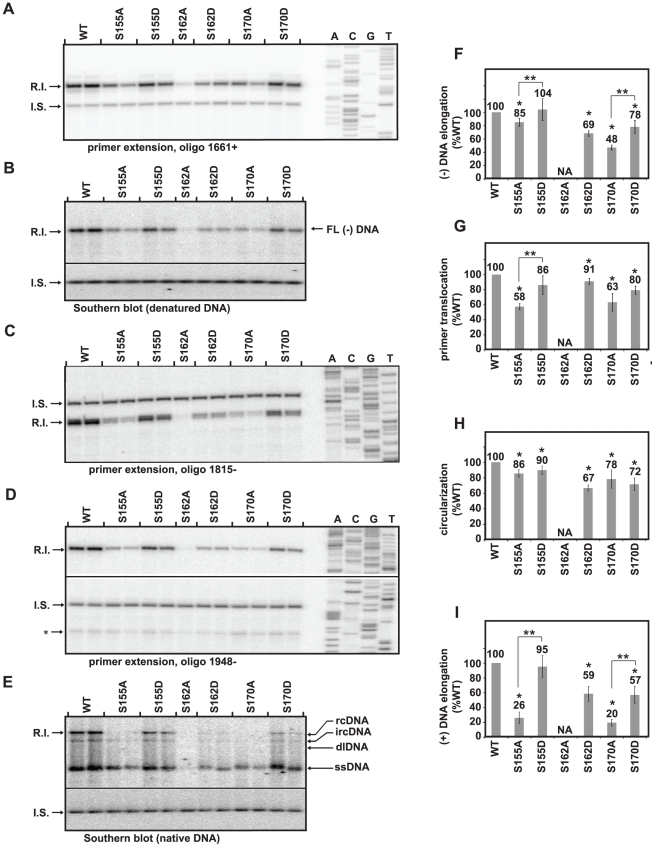
Figure 4. Analyses of (-) DNA elongation, primer translocation, circularization, and (+) DNA elongation.
The position of the replicative intermediate band (R.I.) and internal standard band (I.S.) that were measured are indicated. (A) Primer extension with oligonucleotide 1661+ to detect (-) DNA that is, at least, 164 nt in length. (B) Southern blot with heat-denatured DNA to detect fully-elongated (-) DNA. (C) Primer extension with oligonucleotide 1815- to detect (+) DNA initiated from DR2. (D) Primer extension with oligonucleotide 1948- to detect circularized, DR2-initiated (+) DNAs. The position of in situ-primed (+) DNAs is indicated (*). (E) Southern blot with native DNA. Positions of ssDNA, dlDNA, ircDNA, and full-length rcDNA are indicated. Both native and denatured southern blots were probed with oligonucleotides 1816+, 1833+, 1857+, and 1876+. (F–I) Each histogram shows the efficiency of (-) DNA elongation, primer translocation, circularization, and (+) DNA elongation relative to the wild type reference, as calculated with equations in Fig. S3. S162A was not analyzed (NA) because DNA levels were below the limits of reliable quantitation due to accumulation of defects at earlier steps in replication. (*) indicates a significant difference between each variant and the wild type reference and (**) indicates a significant difference between the variants grouped by brackets (p<0.05). The standard deviation of each variant after normalization to the wild type reference is provided to give an impression of the sample variability, although non-parametric statistical tests were used for calculation of p-values.

