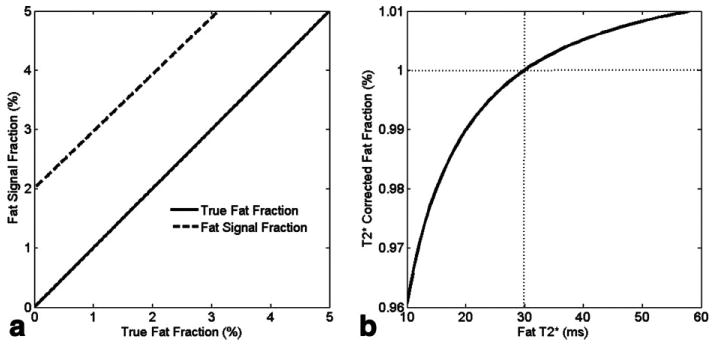
FIG. 2.

a: Fat signal fraction in the presence of effects with . The effects lead to 2% of bias at the true fat fraction = 0. b: Simulated fat fraction after correction (i.e., Eq. 5) with , and varies from 10 ms to 60 ms. The correction was performed using 30 ms to correct for both the water and fat signals. Assuming the true fat fraction is 1% (point as the dotted lines crossed, where corrected fat fraction is also 1%), the deviation from true value is less than 0.04% in the worst case.
