FIG. 3.

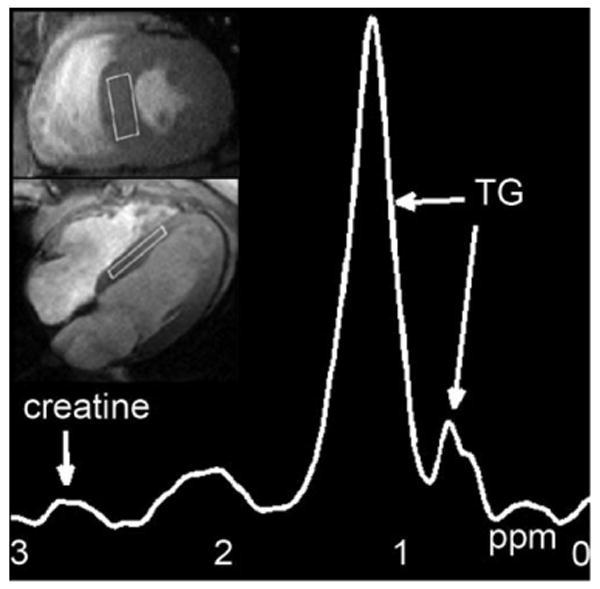
Representative 1H-MRS water-suppressed fat spectrum on a participant with the selected volume superimposed on four-chamber and short-axis cine MR images; TG: triglyceride peaks at 0.9 and 1.3 ppm.

Representative 1H-MRS water-suppressed fat spectrum on a participant with the selected volume superimposed on four-chamber and short-axis cine MR images; TG: triglyceride peaks at 0.9 and 1.3 ppm.